I have a dictionary and I would like to create a map of heat or heatmap or densitymap of specific values. I only manage to plot the points but not the heat map. This is what I have.
for id,msj in diccionario.items():
    pylab.plot(msj['Longitud'],msj['Latitud'],'.')
With the above it works perfectly and I can see the figure of all the plotted points, but what I need is a heat map, I have tried this, but it does not work.
for id,msj in diccionario.items():
    plt.hexbin(msj['Longitud'],msj['Latitud'])
msj [length] and msj [latitude] are lists. The error I get is:
ValueError: First argument must be a sequence
Any ideas?
Maybe there is some other way to create a heat map, I do not mind using another method or library.
EDIT:
I have solved it by using two variables, lon and lat with this code:
lon=[]
lat=[]
for id,msj in diccionario.items():
    lon.append(msj['Longitud'])
    lat.append(msj['Latitud'])
plt.hexbin(lon,lat)
I've tried using hist2d too and I get something like this.

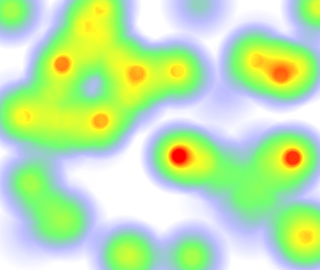
Is there any way to get something "nicer"? of the type this: