I need to obtain a grid of images from Google Maps (static maps API) with certain characteristics, which would be:
- No label or poster.
- All black buildings (
0x000000). - All roads, highways, highways, ..., white (
0xffffff). - All parks, forests or undeveloped areas, green (
0x00ff00). - All rivers, lakes or areas with blue water (
0x0000ff).
Requesting a static map without configuring anything, we get an image like this:
https://maps.googleapis.com/maps/api/staticmap?center=Barcelona&size=400x400&zoom=18
So I've added certain configurations:
-
style=element:labels|visibility:offto remove labels and posters. -
style=feature:road|color:0xffffffto show blank paths. -
style=feature:landscape|color:0x000000to show buildings in black. -
style=feature:poi.park|color:0x00ff00to show parks in green. -
style=feature:water|color:0x0000ffto show water areas in blue.
With this configuration the result has changed to:
https://maps.googleapis.com/maps/api/staticmap?center=Barcelona&size=400x400&zoom=18&size=400x400&style=element:labels|visibility:off&style=feature:road|color:0xffffff&style=feature:landscape|color:0x000000&style=feature:poi.park|color:0x00ff00&style=feature:water|color:0x0000ff
Render problems.
I've almost got what I need, except for the following problems:
- The buildings are still showing their 3D model and superimposing their projection on the roads and highways, falsifying their layout as they are partially hidden (in the example you can see a path cut in the center left).
- There are buildings that are not shown in black (in the example you can see one in the upper center).
I would like to be able to deactivate the 3D buildings of the map render and / or render them in another color (for example red 0xff0000 ) as well as include in the render all the buildings (apparently landscape is not the category for all the buildings).
Coordinate problems.
I get the coordinates of a location using the Google Geocoding API, using the coordinates obtained I extract clippings from a specific location that placed next to each other give rise to the complete map of the location ( For example, for Mexico DC, it returns latitude 19.5927571 length -98.9604482 as upper left coordinate and latitude 19.1887101 length -99.3267771 as lower right coordinate) by trial and error I have been able to verify that shifting the length multiples of 0.0043 with zoom 17 each of the cuts fits horizontally but (following in Mexico) I must increase the latitude 0.0041 to have the same effect.
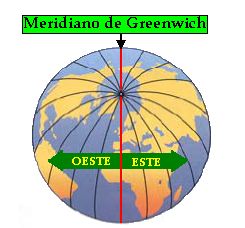
Also, the cutouts will be unraveled as I move vertically away. This is probably due to the fact that the meridians are getting narrower as we move towards North or South:

[I created a Fiddle] that shows this effect, is ready to work " almost right " in Mexico DC, but any other coordinate shows bigger deficits. In the example Fiddle you can see how the second row of images gets out of line with the previous row as we move to the right.
Questions.
- How can I force all buildings to be displayed in the same color?
- How should I deactivate the render of 3D buildings at high zoom levels?
- How can I solve the problem of the uncertainties of clippings when moving by coordinates?